── Attaching core tidyverse packages ──────────────────────── tidyverse 2.0.0 ──
✔ dplyr     1.1.3     ✔ readr     2.1.4
✔ forcats   1.0.0     ✔ stringr   1.5.0
✔ ggplot2   3.4.4     ✔ tibble    3.2.1
✔ lubridate 1.9.3     ✔ tidyr     1.3.0
✔ purrr     1.0.2
── Conflicts ────────────────────────────────────────── tidyverse_conflicts() ──
✖ dplyr::filter() masks stats::filter()
✖ dplyr::lag()    masks stats::lag()
ℹ Use the conflicted package (<http://conflicted.r-lib.org/>) to force all conflicts to become errorsWorkflow and Formatting
Rubrics for workflow and formatting
Breakdown of overall workflow and formatting grading listed below:
- 1 pts: 1 point given if all code chunks are appropriately labelled
- take off 0.5 pt if anything less
- take off 1 pt if none of the code chunks are appropriately labelled
- 3 pts: Consistent code style.
- 1 point given if narrative and text does not exceed the 80 character limit.
- 1 point given for consistent use of operators (i.e. %>% or |> and <- or = but not both)
- 1 point given for consistent and appropriate use of spacing (i.e. pipes and layers followed by newline and binary operators like + and - are surrounded by spaces)
- 1 pt: author name updated to the student’s name at the YAML (at the top) of the document.
Common Mistakes
1. meaningless labels
iris |>
  glimpse()
Rows: 150
Columns: 5
$ Sepal.Length <dbl> 5.1, 4.9, 4.7, 4.6, 5.0, 5.4, 4.6, 5.0, 4.4, 4.9, 5.4, 4.…
$ Sepal.Width <dbl> 3.5, 3.0, 3.2, 3.1, 3.6, 3.9, 3.4, 3.4, 2.9, 3.1, 3.7, 3.…
$ Petal.Length <dbl> 1.4, 1.4, 1.3, 1.5, 1.4, 1.7, 1.4, 1.5, 1.4, 1.5, 1.5, 1.…
$ Petal.Width <dbl> 0.2, 0.2, 0.2, 0.2, 0.2, 0.4, 0.3, 0.2, 0.2, 0.1, 0.2, 0.…
$ Species <fct> setosa, setosa, setosa, setosa, setosa, setosa, setosa, s…Some good examples
iris |>
  glimpse()
Rows: 150
Columns: 5
$ Sepal.Length <dbl> 5.1, 4.9, 4.7, 4.6, 5.0, 5.4, 4.6, 5.0, 4.4, 4.9, 5.4, 4.…
$ Sepal.Width <dbl> 3.5, 3.0, 3.2, 3.1, 3.6, 3.9, 3.4, 3.4, 2.9, 3.1, 3.7, 3.…
$ Petal.Length <dbl> 1.4, 1.4, 1.3, 1.5, 1.4, 1.7, 1.4, 1.5, 1.4, 1.5, 1.5, 1.…
$ Petal.Width <dbl> 0.2, 0.2, 0.2, 0.2, 0.2, 0.4, 0.3, 0.2, 0.2, 0.1, 0.2, 0.…
$ Species <fct> setosa, setosa, setosa, setosa, setosa, setosa, setosa, s…iris |>
glimpse()Rows: 150
Columns: 5
$ Sepal.Length <dbl> 5.1, 4.9, 4.7, 4.6, 5.0, 5.4, 4.6, 5.0, 4.4, 4.9, 5.4, 4.…
$ Sepal.Width <dbl> 3.5, 3.0, 3.2, 3.1, 3.6, 3.9, 3.4, 3.4, 2.9, 3.1, 3.7, 3.…
$ Petal.Length <dbl> 1.4, 1.4, 1.3, 1.5, 1.4, 1.7, 1.4, 1.5, 1.4, 1.5, 1.5, 1.…
$ Petal.Width <dbl> 0.2, 0.2, 0.2, 0.2, 0.2, 0.4, 0.3, 0.2, 0.2, 0.1, 0.2, 0.…
$ Species <fct> setosa, setosa, setosa, setosa, setosa, setosa, setosa, s…If you have multiple models or plots for the homework/labs, you can number them.
iris_boxplot <- iris |>
  as_tibble() |>
  ggplot(aes(y = Petal.Width, x = Species)) + geom_boxplot()
2. Inconsistent use of operator
Bad examples: use both %>% and |>, both <- and = in the homework/lab.
iris_boxplot <- iris |>
  as_tibble() %>%
  ggplot(aes(y = Petal.Width, x = Species)) +
  geom_boxplot()
iris_tbl <- iris |>
as_tibble()
iris_boxplot = ggplot(iris_tbl, aes(y = Petal.Width, x = Species)) +
geom_boxplot()Good examples:
iris_boxplot <- iris |>
  as_tibble() |>
  ggplot(aes(y = Petal.Width, x = Species)) +
  geom_boxplot()
iris_tbl <- iris |>
as_tibble()
iris_boxplot <- ggplot(iris_tbl, aes(y = Petal.Width, x = Species)) +
geom_boxplot()3. Narrative and text exceeding character limit
Bad examples: text overflow. Only part of the text will appear in both coding part and plot.
iris |>
  as_tibble() |>
  ggplot(aes(y = Petal.Width, x = Species)) +
  geom_boxplot() +
  labs(title = "The title is super long and exceeds the word limits. Please do not take my points off.")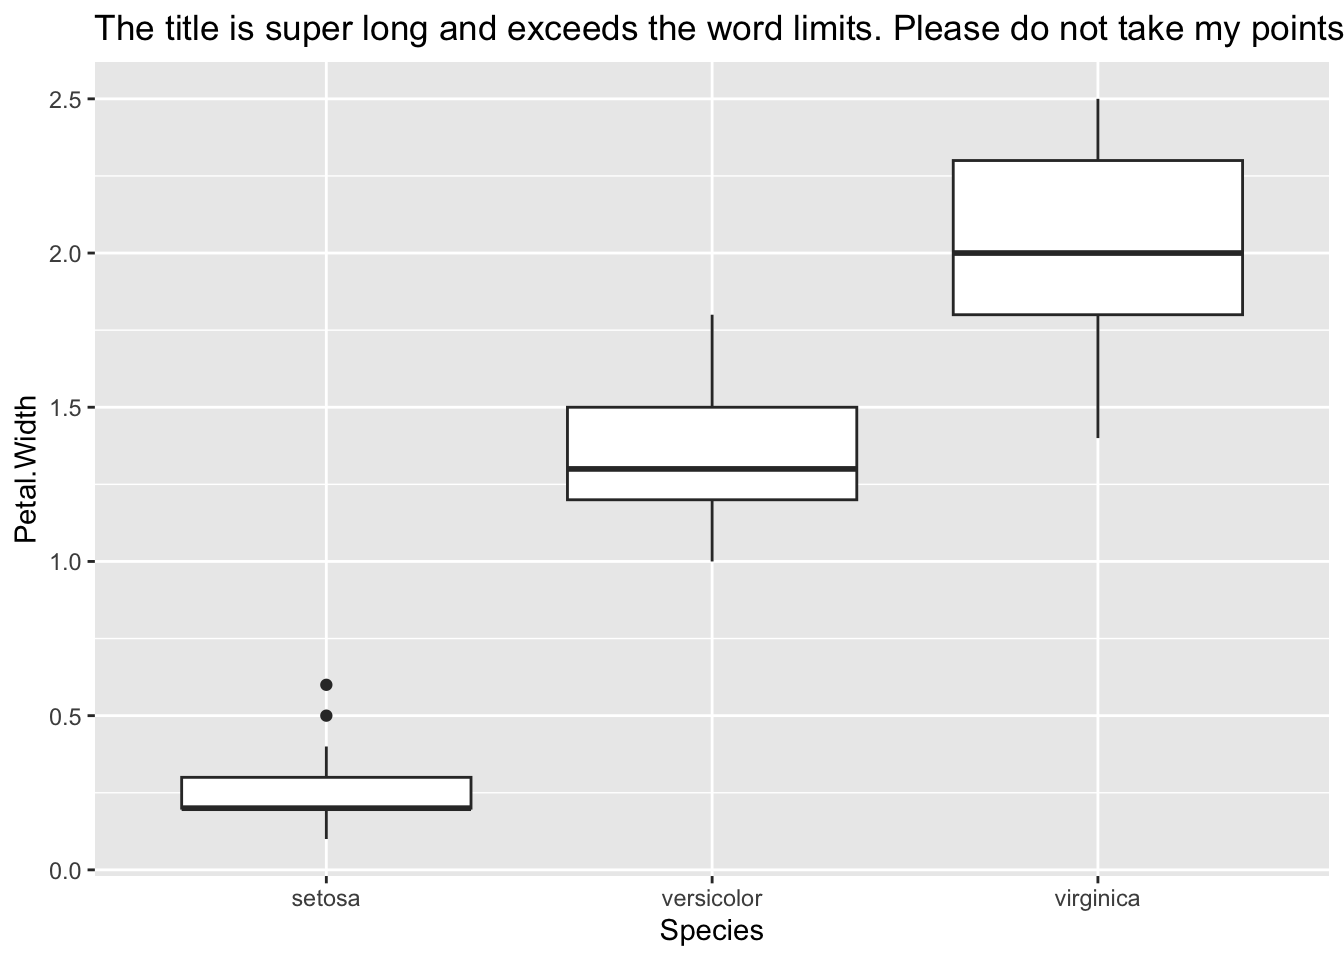
Possible solutions: have a new line inside your code or have subtitle. It is always a good idea to do proofreading on your knitted pdf file.
iris |>
  as_tibble() |>
  ggplot(aes(y = Petal.Width, x = Species)) +
  geom_boxplot() +
  labs(title = "The title is super long and exceeds the word limits.
       Please do not take my points off.")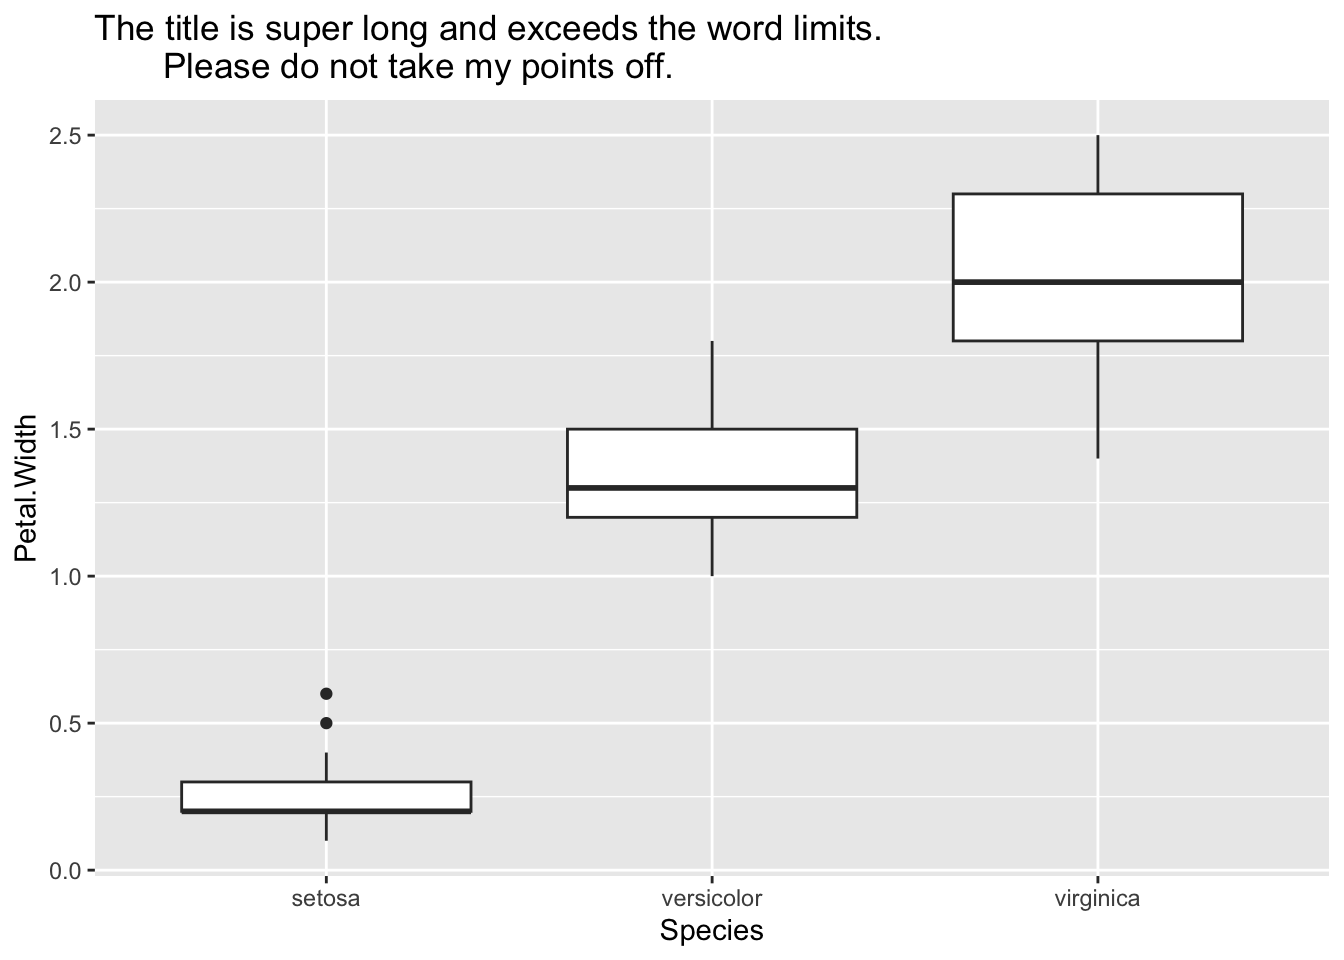
iris |>
  as_tibble() |>
  ggplot(aes(y = Petal.Width, x = Species)) +
  geom_boxplot() +
  labs(title = "The title is super long and exceeds the word limits.",
       subtitle = "Please do not take my points off.")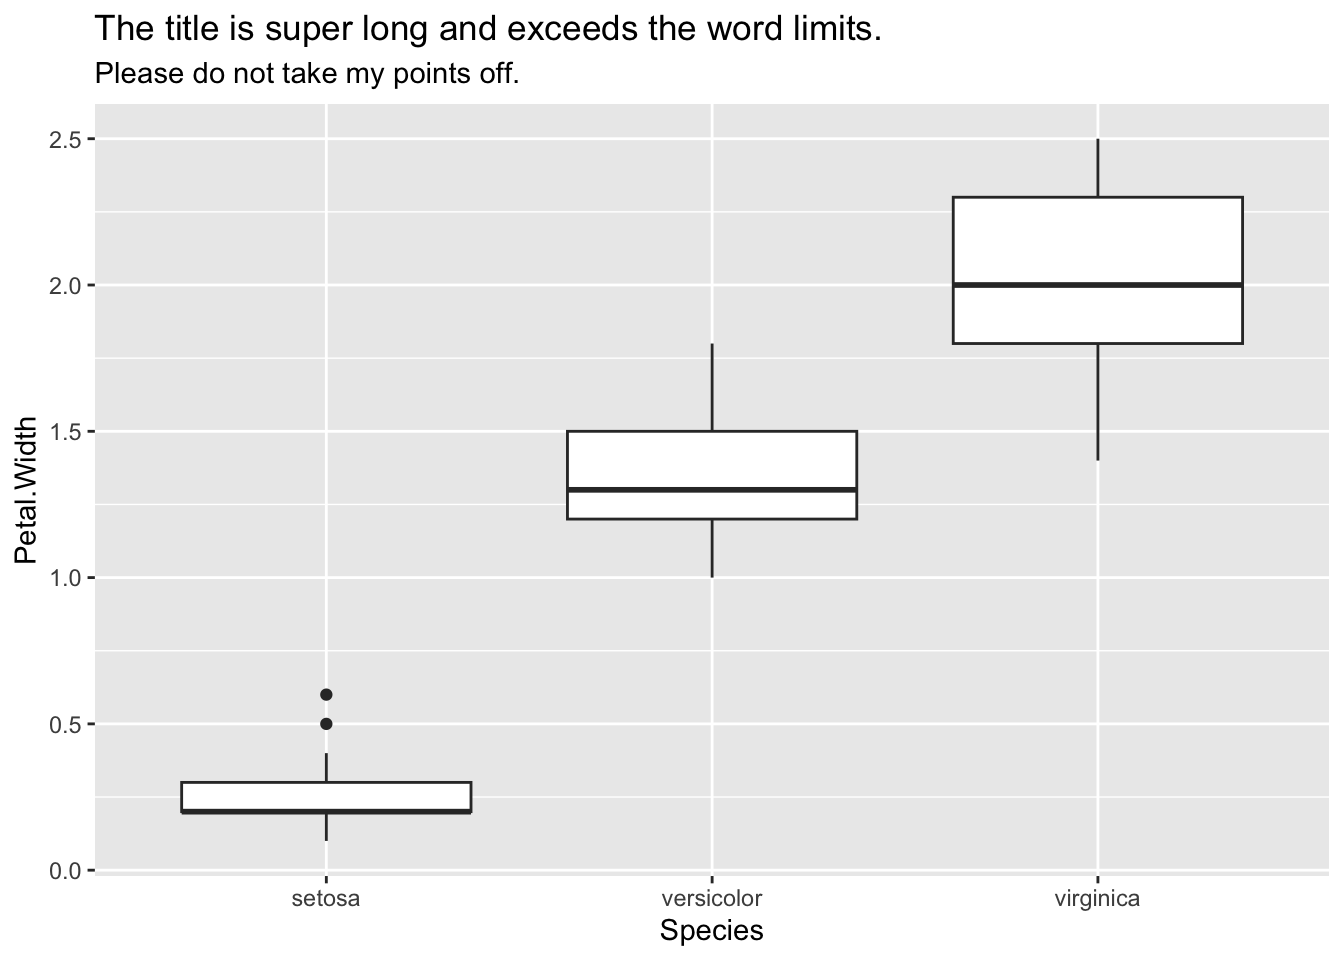
Bad examples: text overflow when the functions have a lot of arguments needed specification
iris_boxplot <- iris |>
  as_tibble() |>
  ggplot(aes(y = Petal.Width, x = Species, fill = Species)) +
  geom_boxplot() +
  labs(title = "Boxplot for petal width versus species", x = "species", y = "petal width", fill = "species")
A solution: represent them in separate lines
iris_boxplot <- iris |>
  as_tibble() |>
  ggplot(aes(y = Petal.Width, x = Species, fill = Species)) +
  geom_boxplot() +
  labs(title = "Boxplot for petal width versus species",
       x = "species",
       y = "petal width",
       fill = "species")
4. Inappropriate use of spacing
Bad example: +/-/=/</| are not surrounded by spaces
iris_boxplot<-iris|>
  as_tibble()|>
  ggplot(aes(y=Petal.Width, x=Species, fill=Species))+
  geom_boxplot()
Good example:
iris_boxplot <- iris |>
  as_tibble() |>
  ggplot(aes(y = Petal.Width, x = Species, fill = Species)) +
  geom_boxplot()
5. New layer/pipline not begin with a newline
The code should be in a newline if it is a new function, such as pipeline, ggplot layers, model fitting.
Bad examples:
iris_boxplot <- iris |> as_tibble() |>
  ggplot(aes(y = Petal.Width, x = Species)) +
  geom_boxplot()
iris_boxplot <- iris |>
as_tibble() |>
ggplot(aes(y = Petal.Width, x = Species)) + geom_boxplot() iris_boxplot <- iris |>
as_tibble() |>
ggplot(aes(y = Petal.Width, x = Species)) +
geom_boxplot() + ggtitle("Boxplot for width versus species")Good examples
iris_boxplot <- iris |>
as_tibble() |>
ggplot(aes(y = Petal.Width, x = Species)) +
geom_boxplot() +
ggtitle("Boxplot for width versus species")