Hypothesis Testing
Lecture 21
Duke University
STA 199 - Summer 2023
2023-11-09
Checklist
– Clone ae-21
– Keep up with Slack
– Draft Report Due November 15
– Exam-2 released November 16
— Cumulative with a focus on content post Exam-1
Project Feedback Expectations
– Close Issues on GitHub
– Incorporate feedback into Draft Report
Note: You do not need to go back and change your proposal
Warm up: Notation Check
– \(\mu\)
– \(\hat{p}\)
– \(\bar{x}\)
– \(\pi\)
Warm up: Notation Check
– \(\mu\) – True mean
– \(\hat{p}\) – sample proportion
– \(\bar{x}\) – sample mean
– \(\pi\) – True proportion
Warm up
Last time, we tested if you could read Martian. The null and alternative hypotheses were as followed:
\(Ho: \pi = 0.5\)
\(Ha: \pi > 0.5\)
– Why \(\pi\)?
– Why 0.5?
– Why > ?
Last Time

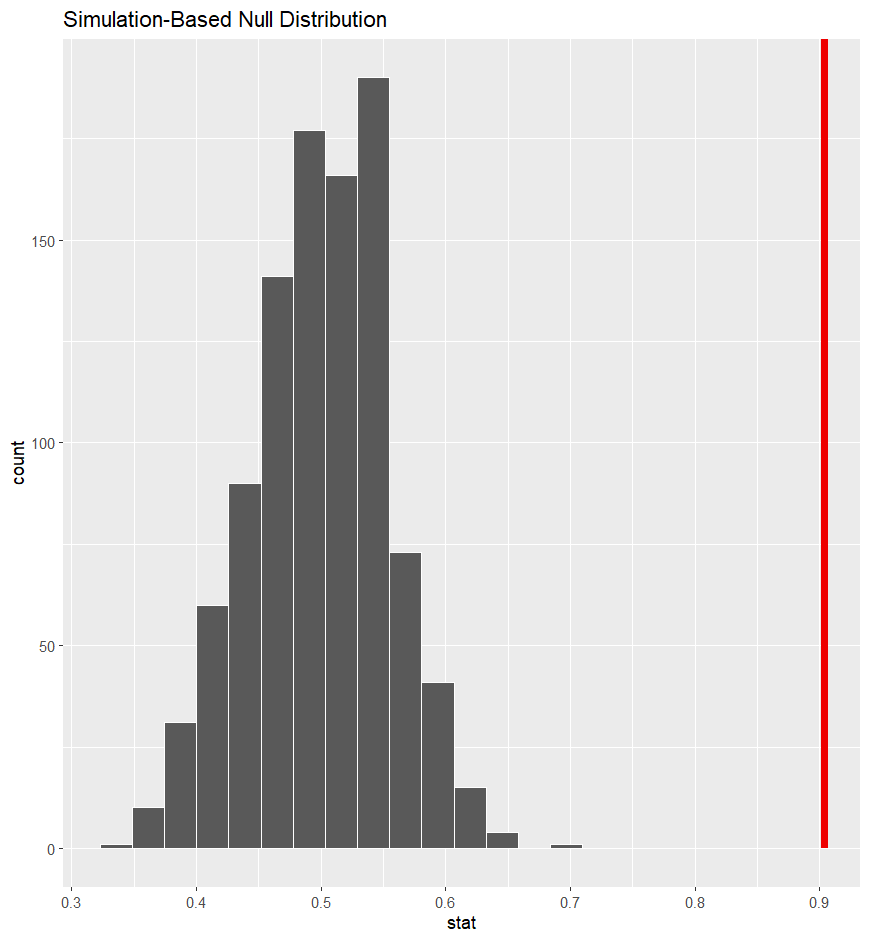
– Based on the visualization, is it likely to see our statistic under the assumption of the null hypothesis?
P-value
A statistical tool to help back up our visual conclusion is called a p-value. The definition of a p-value can be broken down into the following part:
– probability
– of observing our statistic
– or something “more extreme”
– given that the null hypothesis is true
Note: When we say more extreme, we either mean greater, smaller, or different. This is dictated by our alternative hypothesis!
P-value

– What is our p-value here?
- But probabilities can never be 0, so we report this as < 0.001.
How we use the p-value
We use p-values to write decisions and conclusions:
– Decision: Reject or Fail to reject the null hypothesis
– Conclusion: Strong or Weak evidence to conclude the alternative hypothesis
ae-21
— Why we can’t conclude the null
— hypothesis testing
