Quarto + R Intro
Lecture 2
Duke University
STA 199 - Summer 2023
2023-08-31
Checklist
– Are you on Slack?
– Have you reserved a Duke 198/199 container?
– Have you accepted your GitHub organization invite?
– You can find ae-01 here! We will clone it together as a class
– Chat with TA before or after class / if you are not in Slack or the GitHub org
Announcements
– AE grading (Drop/Add ends - Sep-8th)
– If you are sick and need to request a recording, please do so after lecture is completed
– Lab-0
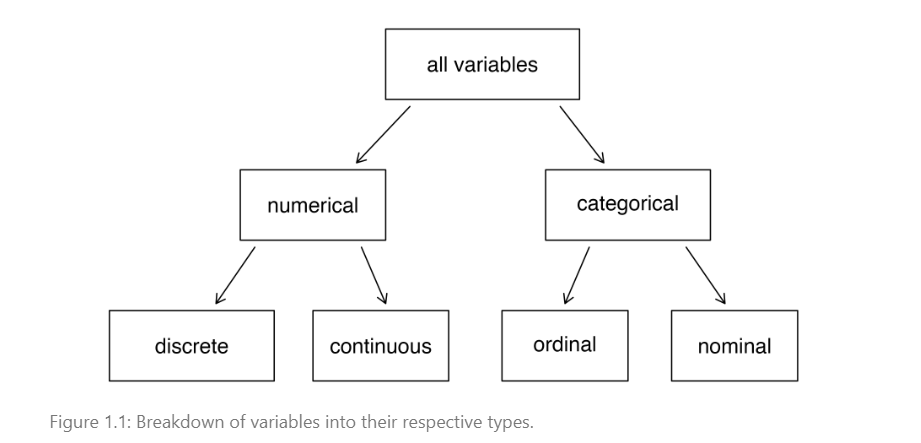
Warm Up 1: Types of Variables
– Height
– Weight
– Zip Code
– Coffee Drinker
Warm Up 1: Types of Variables

Warm Up 2: Variables
– Explanatory Variable
– Response Variable
Warm Up 2: Variables
From the text: When we suspect one variable might causally; predict; influence change in another we label the first variable the explanatory variable and the second the response variable
Warm Up 3: Types of Studies
– Observational Study
– Experiment
Warm Up 3: Types of Studies
Researchers perform an observational study when they collect data in a way that does not directly interfere with how the data arise.
In an experiment, we often manipulate; control; fix; administer the explanatory variable.
Clone ae-01
– This is a similar process to how you will start off each class period
– Next Tuesday, AEs will be in the STA199-f23-1 GitHub organization
Demo: clone ae-01
Goals for today
Basics we will use throughout the semester
- R and RStudio
- Quarto Documents
- Practice
What is R and RStudio?
– R is a statistical programming language
– RStudio is a convenient interface for R

For Today
– R essentials
– R-layout tour
Some R essentials
– Functions are (normally) verbs, followed by what they will be applied to in parentheses:

R essentials
– Packages are installed with the install.packages function and loaded with the library function, once per session:

Packages

library(tidyverse)

Packages

library(tidyverse)

tidyverse

– The tidyverse is a collection of R packages designed for data science.
– All packages share an underlying philosophy and a common grammar.
GitHub: Version control

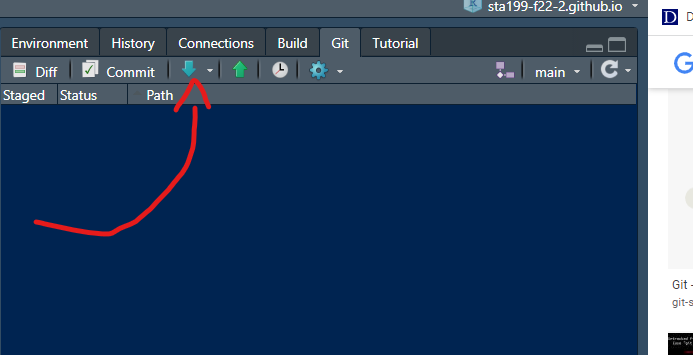
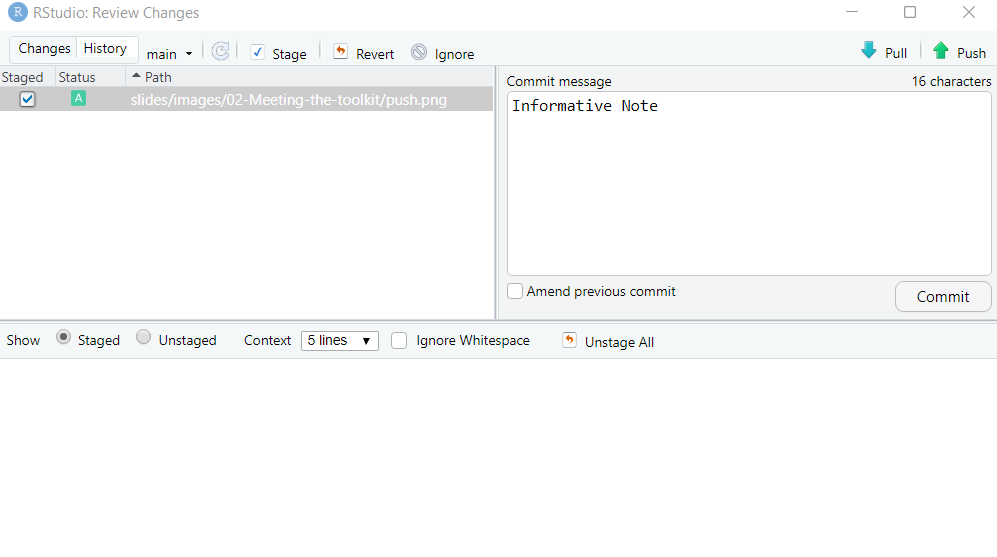
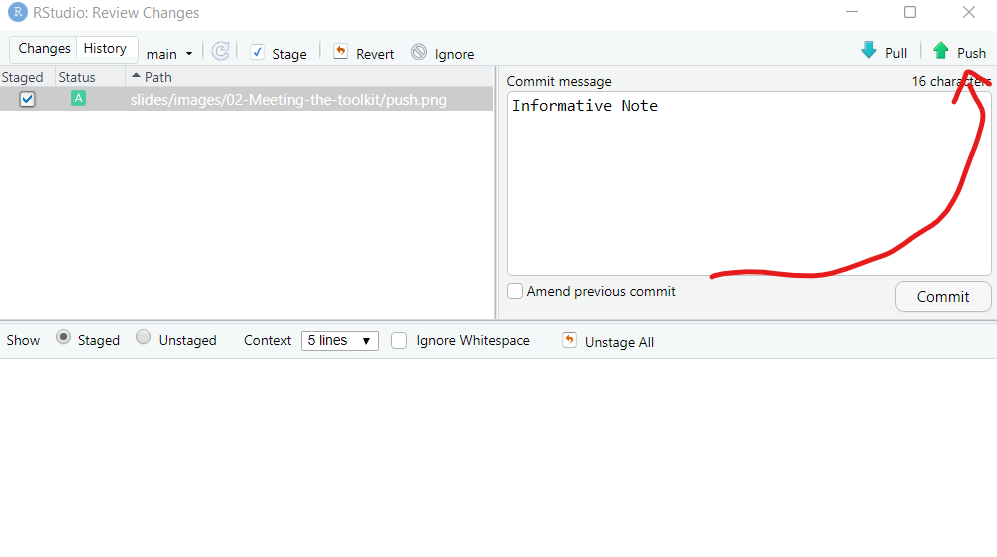
GitHub Commands: Pull Commit Push

GitHub Commands: Pull Commit Push

GitHub Commands: Pull Commit Push

Errors
– Golden Rule: Look for the word Error:
– Server Error: To many files open ….
ae-01
Quarto
– an open-source scientific and technical publishing system
– publish high-quality articles, reports, presentations, websites, blogs, and books in HTML, PDF, MS Word, ePub, and more
– Code goes in chunks, defined by three backticks, narrative goes outside of chunks
How will we use Quarto?
– Every assignment / lab / project will be given to you as a Quarto document
– You will always have a Quarto template document to start with
– As we get more familiar with R, the more code you will construct on your own
The process
You have a data set you want to work with…
mtcars
The process
mtcars
You want to create a visualization. The first thing we need to do is set up the canvas…
The process
mtcars |>ggplot()
The process
mtcars |>ggplot(aes(x = variable.name, y = variable.name))aes: describe how variables in the data are mapped to your canvas
The process
+ “and”
When working with ggplot functions, we will add to our canvus using +
The process
mtcars |>ggplot(aes(x = variable.name, y = variable.name)) +geom_point()The process

ae-01
Wrap up
– What is version control? Why is it important?
– What is R vs RStudio?
– What is Quarto?
